Lifecycle Management
What is Equipment Lifecycle Management?
Equipment lifecycle management (LCM) is a methodology for managing equipment throughout its life span from design and development through end of life. A lifecycle management process is most often applied post production and utilized as an augmenting strategic sustainment strategy for equipment and assets. A lifecycle projection of your equipment’s life along with a costing prediction will help your company predict future overhaul, retrofit or recapitalization expenses well ahead of the failure or even degradation of equipment capability in some cases. This process should be scalable and tailorable to your specific equipment type(s) and variations as there are no cookie cutter solutions to managing your equipment’s lifecycle. The most optimal method for lifecycle managing is to build your plan into the design stage of equipment or product release. The Design for Sustainability (D4S) process for LCM is the most effective way to predict lifecycle events and project failure, it does after all make more sense to pre-empt potential impacts at the design stage.
Post production life cycle management is as much an art as it is a science since pre-established benchmarks have not been established during the D4S process. Initially, there will be little or no data from which to begin the mapping process meaning the Original Equipment Manufacturer (OEM) guidance will be the primary basis for your analysis early on. Most OEMs provide general guidance and will estimate an average life expectancy with wear out dates based on average wear and tear under normal circumstances.
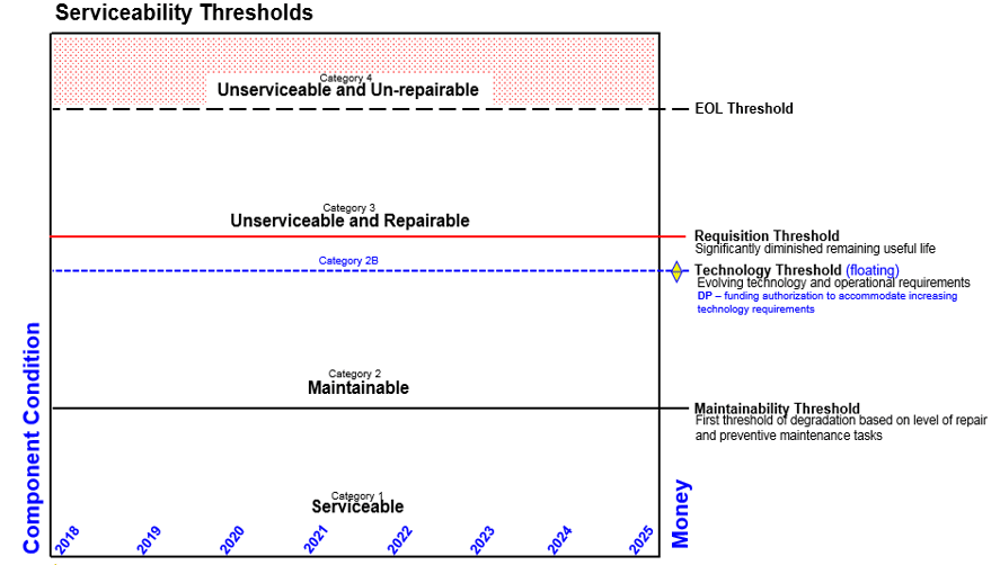
To get started, I would recommend performing a macro assessment of your equipment’s current state along a serviceability threshold map. There are four (4) commonly understood thresholds: serviceable (new), maintainable (some maintenance required), unserviceable and repairable (routine maintenance required), and unserviceable and unrepairable (end of life).
In Depth Analysis
Once all of your equipment is generally assessed and mapped against these thresholds, you will then be able to prioritize your in-depth analysis effort and gain a deeper understanding of your overall status. You can then add layers and build upon the map with additional thresholds, i.e., requisition thresholds, and technology thresholds for use with equipment such as computer hardware, UHF equipment and other rapidly evolving components.
Start with analyzing the category 2 or even category 3 equipment if you have it and begin the arduous task of collecting data. You will want to assemble a broad range of data early on to begin the analysis, most importantly, focus on performance historical data. Here is a complete list of key inputs for consideration as you gather data:
• OEM End of Life predictions
• Performance historical data
• Prior failure rates
• Repair/replacement data
• Wear and tear industry trends
• Form factor considerations
• Increasing performance requirements affecting degradation rate(s)
• Hardware support termination for computers and electronics
• Warranty information
• Diminishing manufacturer sources and material sources (DMSMS)
A lot of this is subjective, but I would recommend harvesting all data relative to the equipment being evaluated. My thoughts are that no data is irrelevant, especially early on in the process, it may not always be evident why a particular data set may be useful, but should be collected nonetheless. The amount of data will then help you determine how to shape your full analysis and make the projection. Obviously, if you have rich data sets spanning several years, your projections will be quite accurate and more thorough utilizing a lifecycle costing methodology. If you are having difficulty gathering data and have little to no OEM guidance, you may want to begin writing a narrative that is centric to replacement based on wear and tear usage with extrapolation that is aligned with warranty expiration. Beyond Economic Repair (BER) is a very direct and almost obvious methodology but not optimal for long term projections. The most common analogy is the car/transmission analogy, if your 2002 Honda Accord has a Kelley Blue Book value of $3200 and your transmission goes out with an estimated replacement cost of $2800, the car is a good candidate for end of life based upon a BER assessment. You would have to establish the criteria for qualification based upon your company’s strategic maintenance budget and internal repair and replacement policy. Your goal should be to apply as many of these evaluative strategies as possible in order to make the most accurate and lengthy projection possible. One of the most complex and thorough methodologies is the lifecycle costing analysis. Typical parameters include depreciation, inflation, maintenance, repairs, and obsolescence, all of which is applied in a formula that helps to produce a lifecycle “cost” by year expressed in dollars. This product is then measured against your company’s annual operating and maintenance (O&M) costs. The product should be displayed in a multiple year scatter chart that represents both the projected life cycle cost along with the operating and maintenance costs. The replacement year is the year that O&M costs reach or exceed lifecycle costs. This methodology and formula are available in the National Institute of Standards and Technology (NIST) handbook.
While easy to get lost in the data, the important thing is to begin the build of a narrative that is broad and intuitive. If data is not readily available, it helps to actually write out the narrative and collect anything relative to the equipment being evaluated.
Talk to the people that are operating the equipment, gather personal testimonies regarding its performance, call OEM engineers and make extrapolations based on like equipment sets from other organizations. Most importantly, start collecting data, establish a deliberate method for harvesting data that will help in future years and solicit buy in from company leadership to build the culture of data harvesting. I’ve sketched some very broad strokes with this discussion, I will build upon this and add some granularity to the discussion in future posts. Come online if you are struggling or have questions.
Lifecycle Costing
As previously discussed, there are no cookie cutter solutions as this is as much an art as it is a science. However, there are a lot of tools for use that can really help executive management make data driven decisions that involve strategic fleet management. One tool for use is called life cycle costing (LCC) and this tool is often used as a foundational assessment of equipment life projections. Life cycle cost is a measure of the total cost of ownership and is commonly used by larger organizations to analyze facility management but it certainly has value added utility in medium and heavy equipment lifecycle projections as well. I will vaguely discuss how I inject a LCC analysis into my larger lifecycle methodology, for LCC formula and specific instruction, please reference the U.S. Department of Commerce and National Institute of Standards and Technology (NIST) Life Cycle Costing Manual (NIST Handbook 135). The life cycle costing analysis will require deep data that dig into multiple relevant cost metrics. Typical parameters include depreciation, inflation, maintenance, repairs, and obsolescence, all of which is applied in a formula that helps to produce a lifecycle “cost” by year expressed in dollars. This product is then measured against your company’s annual operations and maintenance (O&M) costs. The product’s annual life cycle costs and your organization’s operations and maintenance costs are then plotted on a chart with Y axis representing dollars spent and X axis representing the years of service. It may be of value to add the spreadsheet used to track O&M costs to sort of “show the work”. Once all is plotted and you see the intersect, you may add the serviceability thresholds for visual impact. When O&M costs climb at a faster rate you should soon see that the current year O&M costs match or exceed annual life cycle costs. When the two trend lines intersect, you will have reached the End of Life (EOL) candidacy window. If Telehandler was purchased in 2020 (year one), associated maintenance costs are reasonable through about year 2025 when something happens. The rate at which O&M costs climb is significantly accelerated and it matches the calculate life cycle cost by September of calendar year 2025. By 2026, it may be extrapolated that the telehandler is costing more money to maintain than the measured value that it provides.
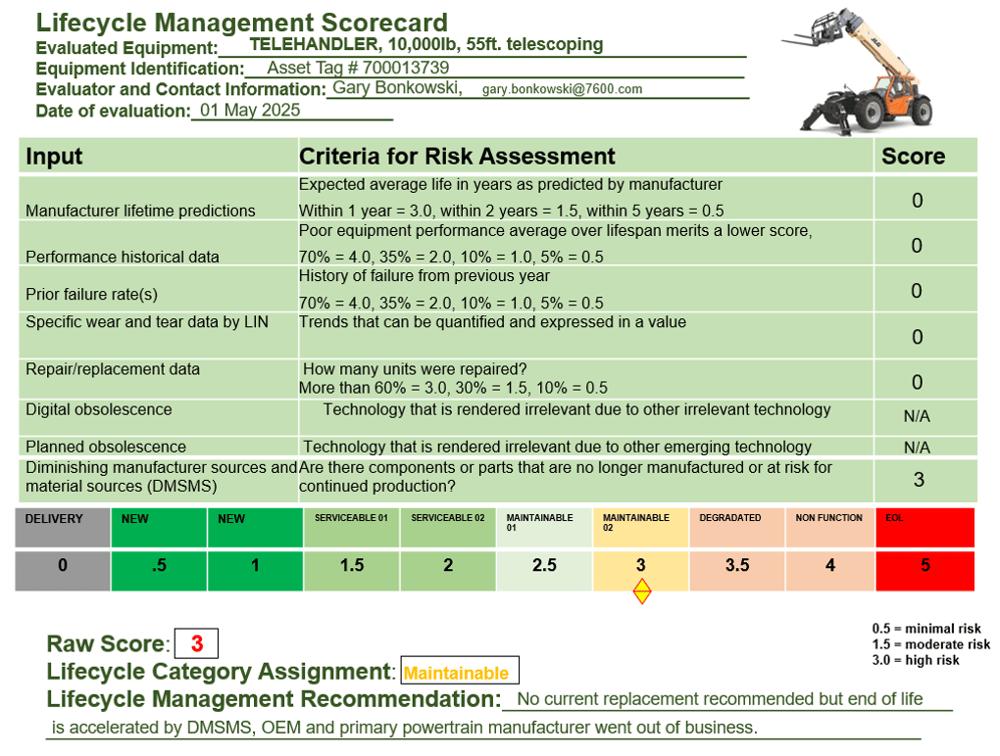
The chart indicates the “when” and helps with some other deeper trend analyses but does little for the “why”. Why did O&M costs skyrocket after only five (5) years? OEM recommendations for medium size material handling equipment may be between seven to twelve years depending on hours, loads, heights accessed, terrain, and weather as examples of criteria used by OEM for end of life recommendations. At five years, this particular model costs more at least two years ahead of schedule. This is where your personalized and detailed equipment service records and evaluated external criteria can be measured in a lifecycle scorecard. The scorecard can be your organization’s highly specialized evaluative tool to micro manage all aspects of an equipment’s characteristics and performance. The scorecard can then produce a raw score which is measured on a scale of your design. Annual or semi-annual evaluations should be conducted in order to truly micro manage these critical micro aspects of performance. In this particular notional example, you will see in the recommendation statement that the telehandler lifecycle was accelerated as a result of DMSMS. This is an industry term for Diminishing Manufacturer Sources and Material Sources. If the availability of critical parts and components diminishes due to business decisions then your score increases and the potential lifecycle may be reduced, sometimes significantly.